Identify dependencies
and risks
Find all your OSS dependencies, check for health, and generate accurate SBOMs with automated Vulnerability Exploitability eXchange (VEX).
Reduce alert noise
by 92%
Combine function-level reachability with EPSS, container scanning, and more to find out which OSS components are actual threats.
Remediate without
breaking changes
Understand how hard an upgrade will be with "upgrade impact analysis", and use a Magic Patch to stay safe when upgrades are too hard.

Trusted by Leading Teams


OSS should be safe to use.
Simplify OSS selection
Endor Labs collects and analyzes a large amount of information about open source and customer packages and uses it to compute the Endor Score, a high-level, easy-to-understand metric of how well a package does based on factors such as security, activity, popularity, and code quality. With this score you can improve OSS selection through two methods:
- Pre-merge checks: Set policies that prevent risky dependencies from being merged into your projects.
- AI-assisted OSS selection: Developers can ask DroidGPT for alternatives to risky projects, with responses scored based on project health.
OWASP Open Source Top 10
The OWASP Open Source Software Top 10 addresses risks that come with using OSS. Vulnerability detection (and sometimes license risks) is where most SCA tools stop but with Endor Labs, you can implement an OSS security program around the list through policy-driven automation that includes:
- Vulnerabilities: Known vulnerabilities associated with a software component.
- Operational Risks: Issues that may make it more expensive to address any application impacting bug, including a security vulnerability.
- License Risk: Issues that may cause legal or compliance risk associated with your software.
Although SBOMs are increasingly becoming required for compliance reasons, in practice most organizations request SBOMs to evaluate the potential risk of a vendor or want the ability to regularly scan SBOMs for new risks. To meet these kinds of expectations, software producers must generate highly-accurate SBOMs each time an app pushes to production. And when a software consumer receives an SBOM, it's to be expected that they will review the components for vulnerabilities. This causes extra work for both producer and consumer, as the consumer has to research each vulnerability or request that the information be provided. A VEX document makes this process simpler by providing a mechanism to classify and label the vulnerabilities. When delivered alongside an SBOM, the VEX informs consumers about any vulnerabilities, including severity, whether it's exploitable, and so on.
With Endor Labs, SBOM and VEX generation can be automated. Because Endor Labs uses your source code as the source of truth, you can have confidence your SBOMs contain every direct and transitive dependency - offering no nasty surprises to your customers. Once your dependencies are mapped, you can generate SBOM and VEX documents that automatically include reachability data, and annotate whether or not an application or library is affected.
SCA shouldn't waste your time.
Eliminate false negatives
Most first-party code relies on additional OSS components to function properly, referred to as “direct dependencies.” While the number of dependencies varies (based on programming language, complexity of the software/application, etc.), the average application has several hundreds of direct dependencies. Additionally, each of those direct dependencies have OSS dependencies of their own, referred to as “transitive dependencies.” This complex ecosystem makes it critical for an SCA tool to find all your dependencies so you can get an accurate picture of risk. But most SCA tools rely on the package manifest for dependency information, which is problematic for languages where the manifest and compiler differ (such as Python and JavaScript). These tools increase your risk of breaches because they fail to identify artifacts that contain vulnerable code because it can’t find dependencies that aren’t in the manifest. Endor Labs scans source code to find hidden dependencies, ensuring you don't miss the next Log4j.
Reduce SCA noise by 92%+
Because most SCA tools can't determine which open source dependencies are in use, they produce false positives: Alerts for every potential dependency with a vulnerability. By using source code as the ground truth and applying program analysis techniques, Endor Labs can pinpoint every direct and transitive dependency in use, down to the functions being called by your application. In addition to producing a highly-accurate map of your dependencies, program analysis enables "reachability-based SCA", so you can quickly de-prioritize the noise based on whether the vulnerable function is reachable.
Learn more in Why Your SCA is Always Wrong.

Consolidate container scanning with SCA
We think the best way to incorporate containers into a dependency management program is with a combination of best-in-class dependency management (Endor Labs) and runtime container scanning tools (e.g. Wiz, Prisma Cloud). This solution offers the benefits of bundling (i.e. an affordable price tag) alongside the benefits of a robust tool. Container scanning with Endor Labs solves the Three Challenges with Container Scanning Solutions while supporting a holistic dependency management program. With Endor Labs you can:
- Find container risks sooner with pre-deployment scans
- Reduce alert noise with deep visibility
- Accelerate remediation with insights
- Establish container provenance with artifact signing
- Support compliance obligations with SBOM and VEX
Learn more in Container Scanning + SCA = Better Together.
Remediation should be easier.
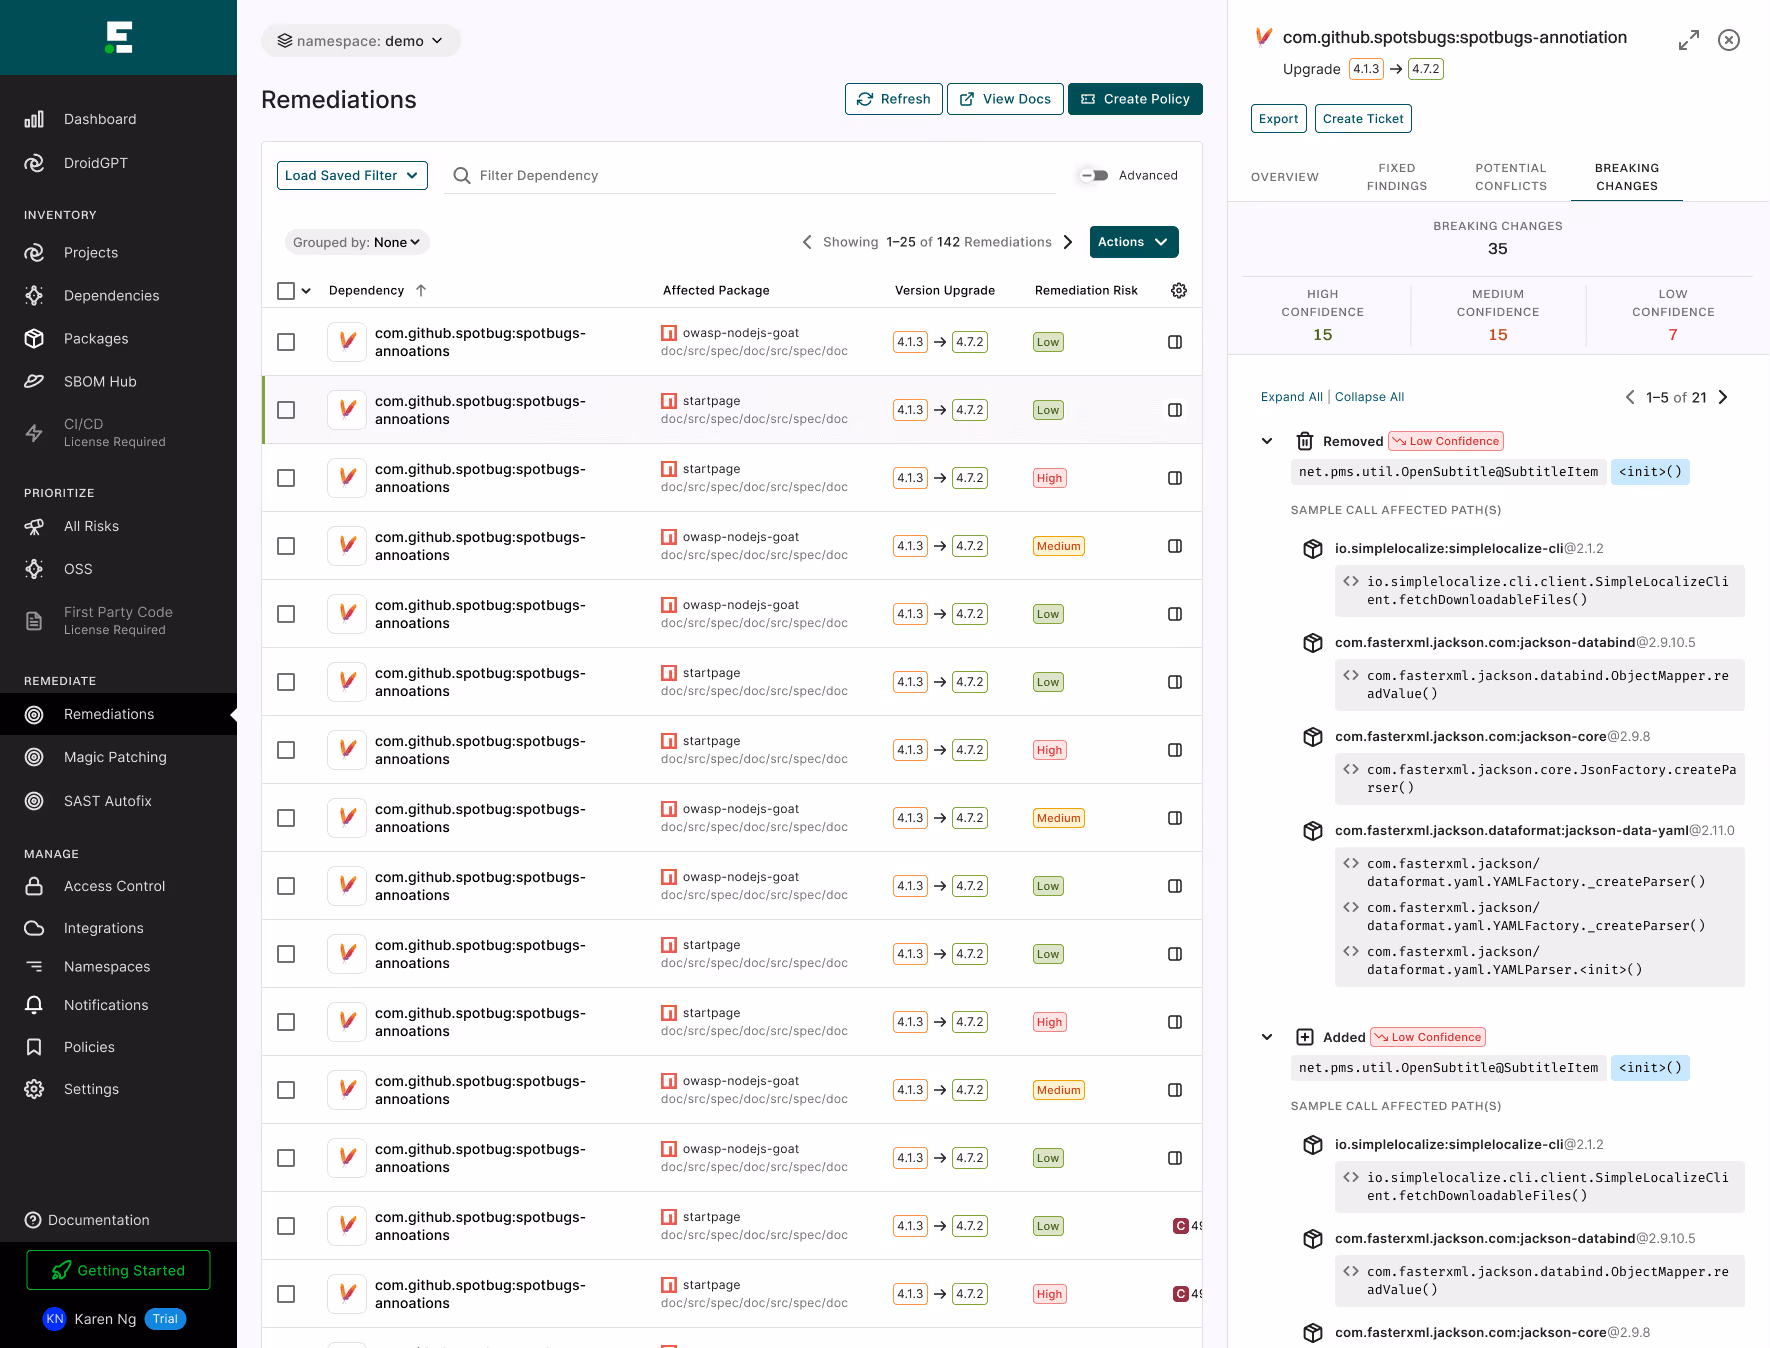
Prioritize upgrades by complexity and impact
By extending the program analysis engine to identify unintended consequences such as breaking changes to an application, AppSec teams understand how fix options impact the app and can manage risk in the context of difficulty.
- Improve return on investment of remediation efforts: Identify which upgrades can have the highest security impact in conjunction with the effort it takes.
- Give time back to developers: Reduce the need for manual research by providing developers with a prioritized list of upgrades ranked by complexity and impact.
- Address risks faster: Make informed estimations of fix efforts with standardized research so you can quickly implement low effort/low risk fixes and make prioritization decisions for complex fixes.
Stay safe when upgrading isn’t possible
Endor Magic Patches eliminate the hassle of hard-to-perform upgrades by providing security patches that are backported to the vulnerable version. The source code, patches, test, build and deploy steps are available to inspect, and the builds are completely reproducible and hermetic.
- Respond to emerging threats: Be ready for the next Spring4Shell with peace of mind that you can obtain a patch and stay safe while you work to upgrade dependencies.
- Balance developer workloads: Reduce the urgency of upgrading so you can let developers focus on releasing their planned features without unexpected delays.
- Support FedRAMP compliance: Mitigate vulnerability risk to protect sensitive information in alignment with government requirements.
Learn more: Upgrades & Remediation
The economic impact of OSS risk prioritization